Relational Machine Learning
(Colab Notebook for the blog post)

In real world data often live in non-euclidean space. Examples include social networks, point clouds, etc. Such data contains topological information and are non-linear in nature. Typical machine learning models treat data point as independent to each other. In this post we will look at a model that exploits the inter-relationship of the data points and apply them to perform machine learning task such classification. First we look at some non-euclidean data
-
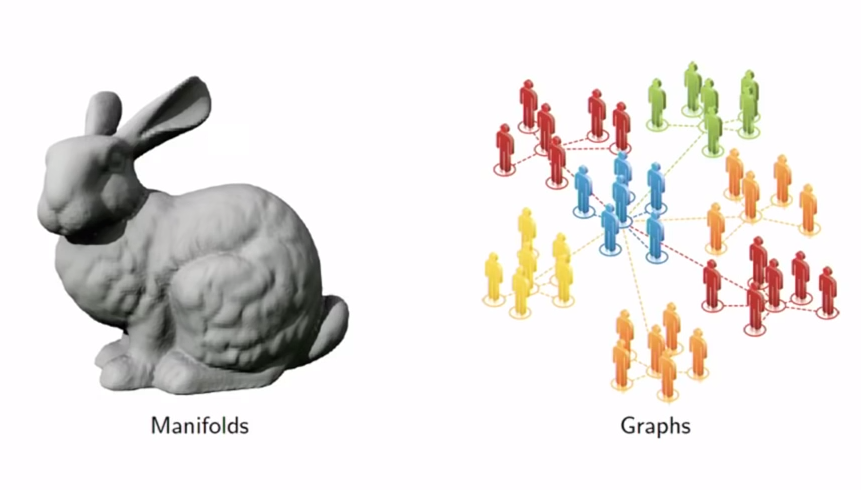
Manifold:
2D shapes that exists in a 3D space in a twisted form. Example includes point clouds. In another example, consider a sheet of paper which is a 2D object which can be rolled and be embedded into a 3D space. Although the paper is still a 2D object, its embedding into high dimensional space is not linear. -
Graph:
Social networks among people
Machine learning on such data requires a model that captures inherent structures among data items. We will look at one such model called Graph Convolutional Network. Inference task is to classify node on the Citeseer network dataset.
Overview of the Citeseer dataset
Citeseer is an academic publication citation network. A publication is considered as a node while a connection between nodes is defined by a publication citing another publication.
- Classes: 6
- Nodes: 3327
- Edges: 4732
- Features: 3703
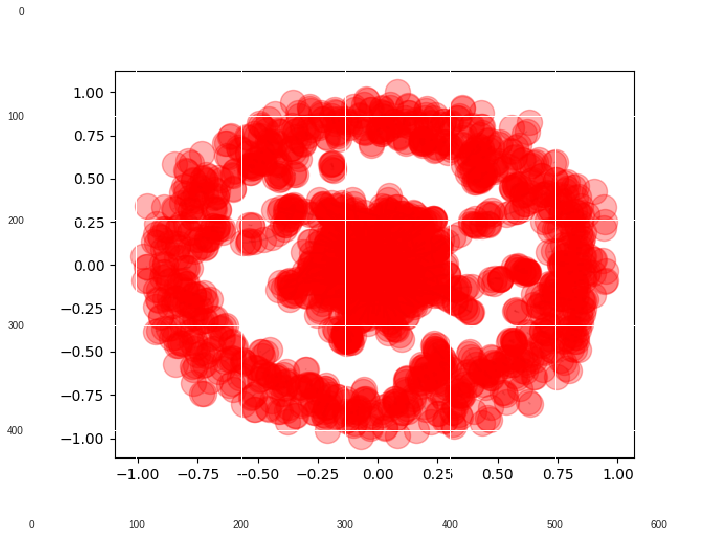
We will first take a look at the citation network. There is a big cluster of nodes that are well connected to each other. On the other hand, there is another set of nodes representing the outer circle in the network with less inter-connectedness (aka low value for clustering coefficients).

In the citeseer dataset, each publication acts as a node in the network with binary features with values 0/1. Each publication belongs to one of the 6 classes representing research areas. Using GCN, these classes are inferred. Code for the inference is provided in this Colab notebook.
Graph convolution neural network (GCN)
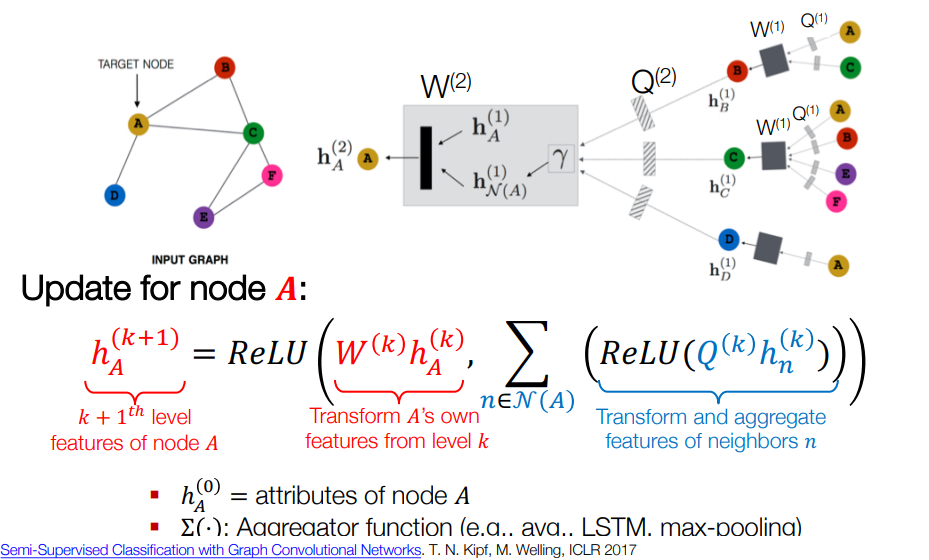
GCN is a semi-supervised learning method combining graph theory and Convolution neural networks. It leverages information from neighboring nodes to infer about a given node in a graph. It works by doing several rounds of covolution. In each round, a node receives information about its neighbors. After two rounds of convolution, a node receives information about neighbors that are two hops away. I have applied GCN to predict research area of publications in the citeseer dataset. I have provided the implementation in the associated Colab notebook. Architecture of GCN and results are discussed here.
Feature representation in a GCN model can be summarized by the formulation
a(D^-1 A H^l W^l)
where a is activation being applied on the matrix multiplication of these terms: D^-1 is degree based normalizer, A is the adjacency matrix, H^l is input at layer l and W^l is the weights at layer l. Note at layer 0, H^0 is the input feature matrix. It is equivalent of one round of information propagation in the graph. An additional round of information propagation will allow a node receive update from the neighbors of its immediate neighbors. It is best described visually by the following image:

We can further apply the feature representation for classification.
Network architecture
There are two hidden layers that perform two rounds of information propagation. In the first round, a node receives information about its neighbors. In the second round, neighbors’ information of a node is propagated to its neighbors. After the first pass, we can say, a node has up-to-date information about its neighbors. When we want to classify a node, a second round of information passing provides the most up-to-date information about the node’s neighbors.
Classification performance:
A confusion matrix is N by N table comparing model’s prediction against true values. It shows how often labels are correctly classified as well as misclassified. GCN confusion matrix is the following.

GCN is able to correctly classify most of the labels with an accuracy of 71% on the test test. Macro F1 score is 0.68 which shows a balance between precision and recall. Model performs best in identifying class 5 while misclassifying only 18% of the samples belong to this class. Misclassification rate in all the classes are [0.55, 0.39, 0.28, 0.29, 0.2, 0.18].
This concludes demonstration of GCN on a graph-based dataset. If you have any questions or comments, feel free to reach out to me through Linked-in.
References:
